
java.lang.IllegalStateException: Default FirebaseApp is not initialized in this process
    at com.google.firebase.FirebaseApp.getInstance()
    at com.google.firebase.remoteconfig.FirebaseRemoteConfig.getInstance()
If you are reading this, you are probably staring at a Play Store Pre-Launch Report or a Firebase Test Lab result, throwing the exact crash above.
Here is the maddening part: You have zero crashes in production. You cannot reproduce this locally. You've cold-started your app on an 8-core physical device 50 times, and it works flawlessly every single time.
You aren't crazy. Your code is experiencing a Heisenbug - a race condition that only exists under the exact, hostile conditions of the Google Play Console's automated testing environment. Attach a debugger, add a log statement, change the timing by a microsecond, and the bug vanishes.
The TL;DR:
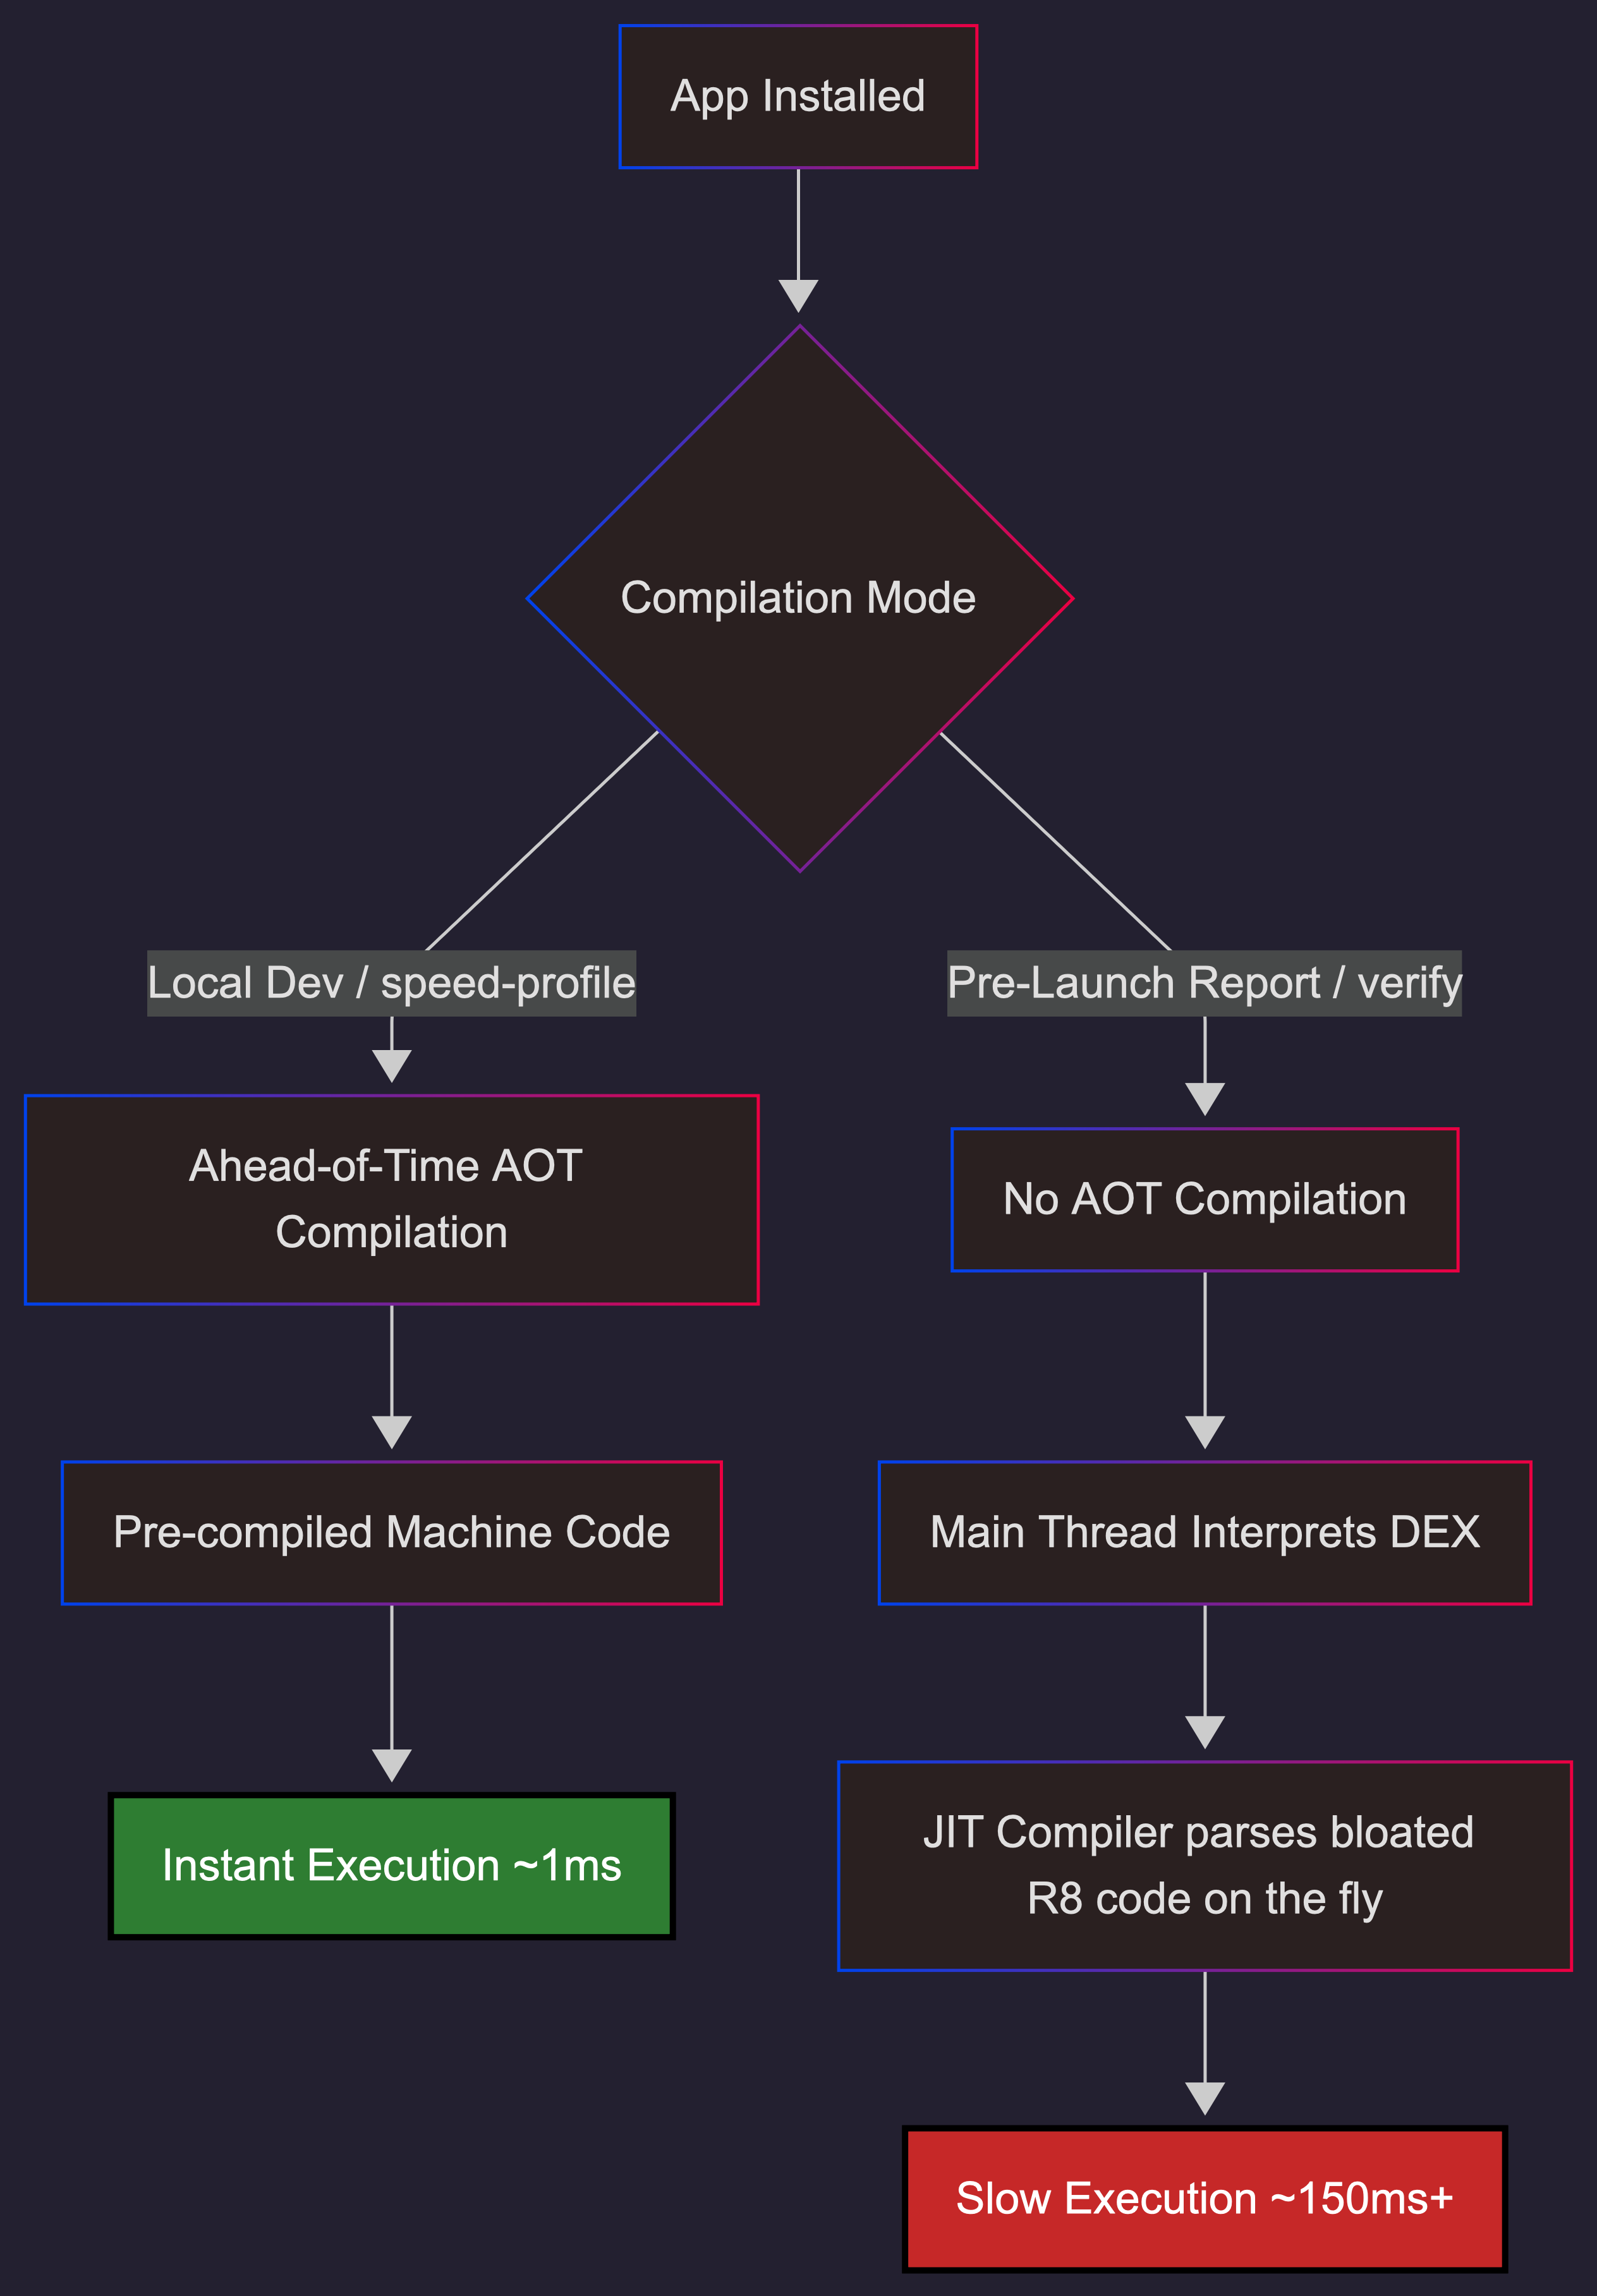
When Google runs your app in a Pre-Launch Report, it is a fresh install running in ART's compiler-filter=verify mode. Your app is running purely interpreted, with zero Ahead-Of-Time (AOT) compilation. Combined with the aggressive structural changes of R8 Full Mode and an emulated environment starved for CPU cycles, a 1ms initialization window that always succeeds on your local device stretches into a 100ms+ bottleneck.
Your background coroutines are losing a race against your main thread's dependency injection.
Here is the exact mechanism of why your app is failing in review, how to force your local emulator to replicate this environment, and the cross-module latch mechanism required to fix it.
👉 Jump straight to the cross-module CountDownLatch fix
1. The Pre-Launch Environment: Running on Hard Mode
Every AAB uploaded to the Play Console triggers a Pre-Launch Report powered by Firebase Test Lab's Robo test. The automated crawler installs the app on physical and virtual devices, exercises the UI, and looks for crashes, accessibility issues, and security vulnerabilities.
The critical detail nobody talks about: freshly installed apps run with compiler-filter=verify.
This means:
- DEX bytecode is verified but not AOT-compiled.
- The app runs in interpreted + JIT mode, which is 30% to 40% slower than AOT.
- Cloud Profiles are not available on a fresh install.
- Baseline Profiles require a background dexopt pass before they take effect.
In Android 14+, the ART Service relies on a background job (pm.dexopt.bg-dexopt=speed-profile) to compile the app. Crucially, this job only executes when the device is idle and charging. Test Lab provisions a device, installs the app, and immediately launches the crawler. The device is never idle. It never compiles.
Google's own Pre-Launch Report documentation says the tests use "real Android devices running Android 9+." It never discloses the ART compilation mode. We verified this — the page describes errors, warnings, performance metrics, and accessibility checks. It says nothing about compiler-filter=verify. This is the gap.
This is a fundamentally different execution environment from your local device, where repeated installs and profile-guided compilation mean your app is running with speed-profile or better.
| Factor | Local dev | Play Store pre-review |
|---|---|---|
| ART compilation | speed-profile or speed (AOT) |
verify (interpreted + JIT) |
| Execution speed | Coroutine launches in ~5ms | Coroutine launch can take 100ms+ |
| CPU contention | Dedicated cores, no background load | dex2oat running + crawler consuming CPU |
| Cloud/Baseline profiles | Available (repeated installs) | Not available (fresh install) |
| Race window | ~1ms (Firebase always wins) | 10-50ms+ (Firebase may lose) |
2. The Multiplier: R8 Full Mode
R8 full mode — enabled by default since AGP 8.0 — applies aggressive optimizations that change code structure in ways that alter initialization timing:
- Vertical class merging: Single-implementation interfaces get merged into their concrete class. A Google engineer confirmed in kotlinx.coroutines #1304 that this specific optimization prevents coroutine dispatch optimization, filing a separate R8 bug.
- Visibility relaxation: Private methods are made public to bypass JVM access checks for cross-class inlining.
- Factory inlining: Hilt factory code (
Module_ProvideXFactory.get()) is inlined directly at call sites. - Constructor removal: Default constructors are stripped when R8 determines they are unnecessary.
What used to be a lightweight virtual dispatch becomes a massive, contiguous block of bytecode directly inside your Application.onCreate().
In AOT mode, this is pre-compiled machine code that executes in microseconds. But in verify mode, the JIT compiler must parse and compile this bloated method on the fly, directly on the main thread. This JIT overhead acts as a massive speed bump, wildly expanding the window for race conditions.
This is not theoretical. Retrofit #3751 documents R8 full mode stripping the generic type information Retrofit needs for reflection. Dagger #1859 shows DoubleCheck.get() contention appearing in production ANR traces when scoped providers fight for the same lock. These are real crashes, in real apps, caused by R8 full mode restructuring code that was never designed for it.
The Double Whammy
The combination is lethal: R8 full mode changes the structure of your code. verify mode changes the speed of execution. Together, they create a runtime environment that has almost nothing in common with your local debug build.
3. The Race Condition: Firebase vs. Hilt
The ContentProvider Trap
The Android initialization sequence is strictly ordered:
ContentProvider.onCreate()— all registered providersApplication.attachBaseContext()Application.onCreate()- Hilt component creation
Many libraries historically relied on ContentProviders for auto-initialization. Firebase used FirebaseInitProvider — a ContentProvider that guaranteed Firebase was ready before Application.onCreate() even ran. It was a silent, invisible dependency that just worked.
The problem: ContentProviders are expensive to instantiate and slow down startup. So many of us migrated to Jetpack App Startup, which replaces multiple ContentProviders with a single one and lets you define explicit dependencies between initializers.
The Typical Migration
- Remove
FirebaseInitProviderfrom the manifest (tools:node="remove"). - Fire a
Dispatchers.IOcoroutine in an App Startup Initializer to callFirebaseApp.initializeApp(). - Let Hilt resolve dependencies like
FirebaseRemoteConfig.getInstance()synchronously duringApplication.onCreate().
This pattern is everywhere. And it's a ticking time bomb.
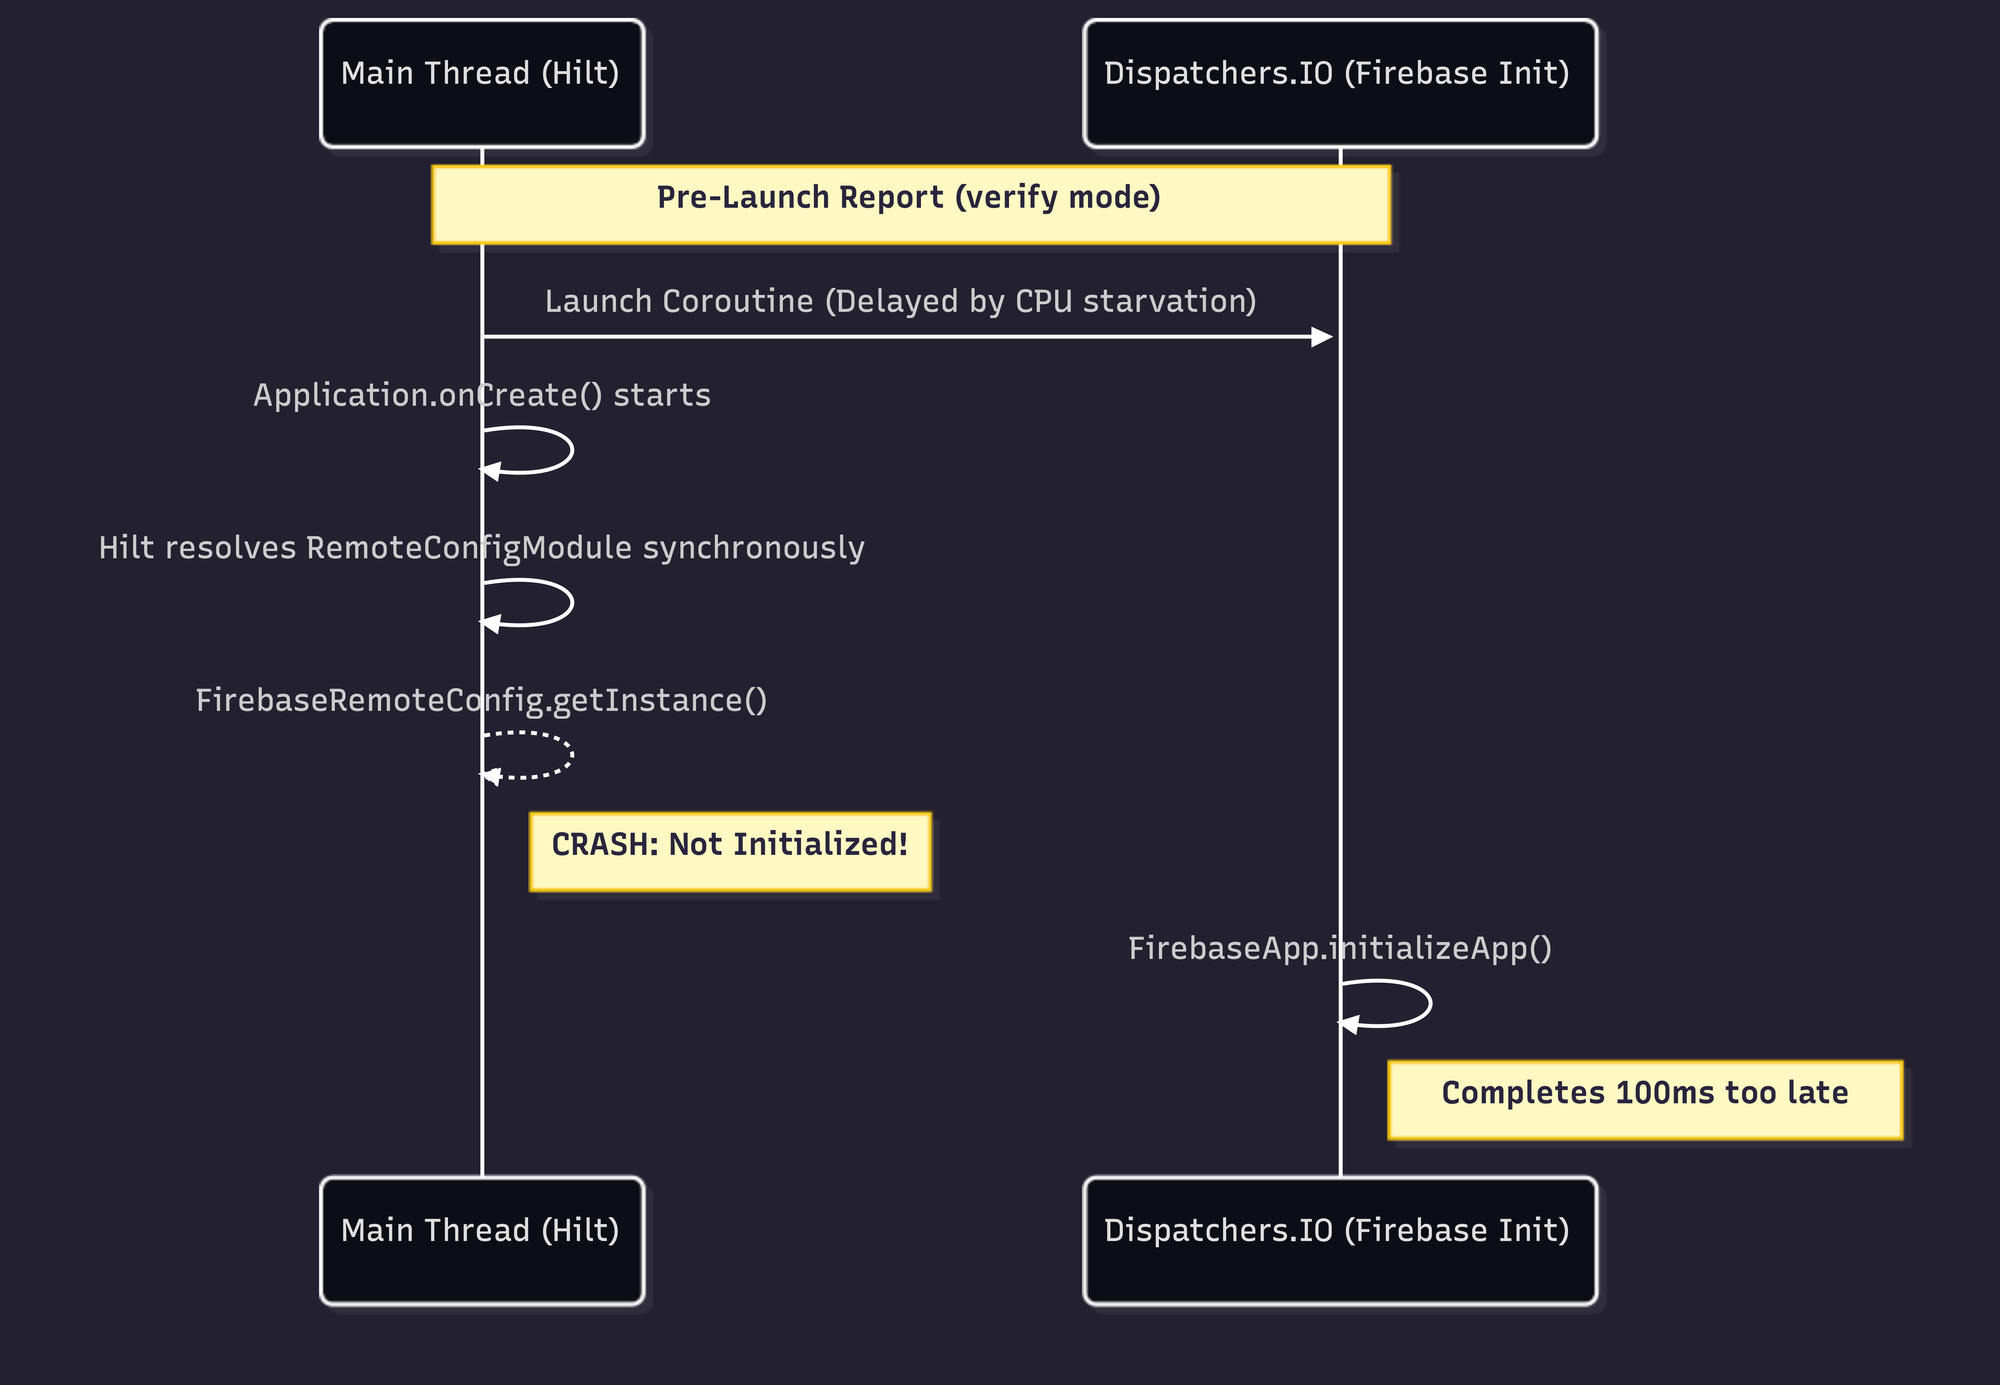
Why It Crashes in Pre-Review
On a flagship phone, that coroutine launches in ~5ms. Firebase always wins the race.
In Test Lab, three heavy processes fight for limited vCPU cycles: your app's main thread, dex2oat verifying DEX files, and the Robo crawler. Because Dispatchers.IO uses a shared thread pool, CPU starvation causes scheduling delays. That coroutine might take 150ms+ to launch. Hilt resolves synchronously on the main thread, beating Firebase to the punch. Result: IllegalStateException.
You're Not Alone
This exact pattern has been reported across the Firebase ecosystem — always with the same bewildered observation that it "only happens on first install from Google Play":
- firebase-android-sdk #4693: "FirebaseApp is not initialized in this process." Multiple reporters confirm it happens "mostly only the very first time the app is started, likely after being installed from Google Play."
- firebase-android-sdk #6145:
Utils.awaitEvenIfOnMainThread()caused a 100% reproducible ANR. The stack trace showsCountDownLatch.await()blocking the main thread — Crashlytics' own internal synchronization failing under the same conditions. - FlutterFire #8837:
Firebase.initializeApp()takes 7.5 seconds until first frame on low-end devices in Play pre-launch reports. The reporter notes it is "not CPU-bound" — suggesting lock contention or I/O bottleneck, not raw computation.
That last one is the closest anyone has come to documenting this publicly. But none of these issues connect the dots to ART compilation mode.
4. The Baseline Profile Trap: Why Your Flagship is Lying to You
If you are dealing with Pre-Launch report crashes and slow startups, you are likely already looking at your Baseline Profiles. But how you generate them — and how fresh they are — dictates whether they survive the real world.
How Baseline Profile Generation Actually Works
A common misconception: the Macrobenchmark profiler works like a CPU sampling profiler, recording which methods are "hot" based on execution time. It does not.
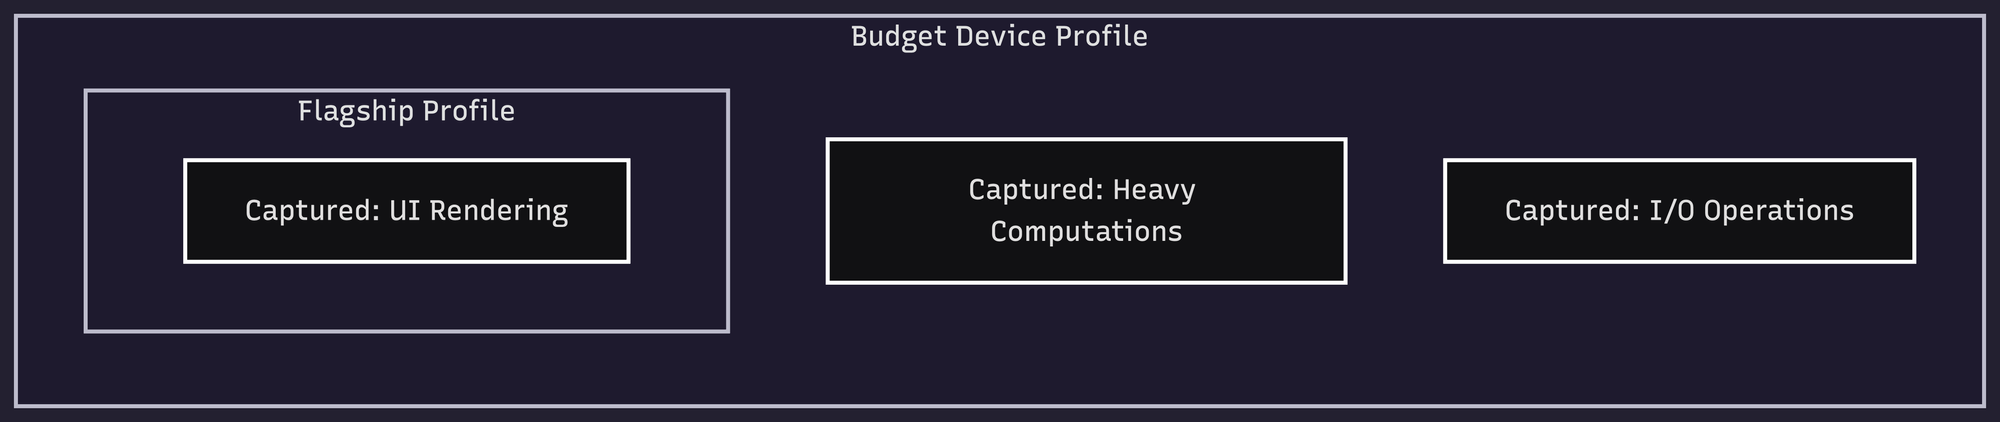
The BaselineProfileRule records which methods were executed during your test journeys. A method is either called or it isn't. It does not matter how fast the device is — the same code paths produce the same profile entries. A method that takes 1 microsecond on a Pixel 9 Pro Fold produces the same profile entry as one that takes 100ms on a Pixel 4a.
What does matter is code path coverage. Your test journeys define which methods get profiled. If your profileBlock only calls startActivityAndWait(), you only capture startup methods. If you also scroll lists, navigate screens, and trigger network calls, you capture those paths too.
Where Device Choice Actually Matters
The device affects the profile in three indirect ways:
- Async content and timeouts: If your test calls
startActivityAndWait()and the device is so slow that async content fails to load before the framework timeout, you miss those code paths. Conversely, extremely fast devices always complete async work, but that's true of any reasonable device. - Reproducibility: A Pixel 9 Pro Fold is not reproducible across team members and CI servers. Google's recommended Gradle Managed Device config — a Pixel 6 API 31 with
aospsystem image — is reproducible anywhere. - Unique code paths: A foldable device may exercise code paths specific to multi-window or large screen layouts that don't represent your median user.
What Meta Learned at Scale
Meta Engineering published a detailed account of their Baseline Profile infrastructure in October 2025. The key insights:
- For complex apps like Facebook and Instagram, benchmarks aren't representative enough. They collect class and method usage data from real users via a custom
ClassLoaderat a low sample rate. - Inclusion threshold matters more than device choice. They started conservatively at 80-90% frequency and lowered it to ≥20% — a method needs to appear in at least 20% of cold start traces to be included.
- Profile size has a ceiling. Compiled machine code is ~10x larger than interpreted code. A bloated profile increases I/O cost through page faults and cache misses. They've occasionally seen regressions from profiles that were too large.
- They optimize beyond startup — feed scrolling, DM navigation, surface transitions.
- Results: up to 40% improvement across critical performance metrics.
The Staleness Problem
For your app, the bigger issue is probably staleness. When you enable R8 full mode, the compiler restructures your code — merging classes, inlining factories, relaxing visibility. The method signatures change. A Baseline Profile generated before R8 full mode was enabled references methods that may no longer exist in the optimized binary.
Since AGP 8.2, R8 rewrites profile rules to match the obfuscated release build, increasing method coverage by ~30%. But this only works if the profile is regenerated from an unminified build in the same pipeline. A 5-week-old profile against a post-R8-full-mode binary is a stale profile.
The Rule: Regenerate every release. Automate it with ./gradlew :app:generateBaselineProfile in CI. Use a Pixel 6 API 31 GMDwith systemImageSource = "aosp". And make your profileBlock cover your critical user journeys, not just startup.
5. Local Testing: Simulating Pre-Launch Conditions
To prove this to yourself, you need to strip the AOT artifacts from your local device and force it into verify mode.
Run these ADB commands:
# Strip AOT, force interpreted mode
adb shell cmd package compile -m verify -f your.package.name

# Cold start with timing
adb shell am force-stop your.package.name
adb shell am start-activity -W -S your.package.name/.MainActivity

# Verify compilation state
adb shell dumpsys package dexopt | grep -A5 "your.package.name"

# Simulate background dexopt with profile (what happens hours after install)
adb shell cmd package compile -m speed-profile -f your.package.name

# Reset to trigger dex2oat on next boot
adb shell cmd package compile --reset your.package.name
The AOSP documentation on ART configuration confirms the compiler filters: verify = DEX code verification only (no AOT compilation), speed-profile = AOT-compile profiled hot methods, speed = AOT-compile everything.
The hard truth: Even with verify mode on a modern 8-core physical device, you might still be too fast to trigger the crash. A 4-core emulator under verify mode is the closest approximation to Test Lab. We ran 30+ cold starts across a Pixel 9 Pro Fold (physical), a Pixel 9a emulator (4 cores), and a custom 1-core/1GB RAM emulator — all in verify mode — and reproduced zero crashes. The Play Store pre-launch environment has additional constraints we can't fully replicate: CPU contention from the Robo crawler itself, whatever specific VM configuration Google uses, and dex2oat running concurrently with app launch.
6. The Fix: Cross-Module Latch Coordination
We know the root cause: Hilt is resolving dependencies synchronously on the main thread faster than our background coroutine can initialize Firebase.
We need to force Hilt to wait, but we have a structural problem. Our FirebaseInitializer lives in the app module, but our dependency injection module lives in a shared core module. We cannot directly reference the background job across module boundaries.
The solution is a thread-safe, cross-module synchronization point.
Step 1: Create the readiness object
In your shared core module, define a simple object to hold a CountDownLatch:
package your.package.common.di

import java.util.concurrent.CountDownLatch
import java.util.concurrent.atomic.AtomicBoolean

object FirebaseReadiness {
    val initLatch = CountDownLatch(1)
    val initSucceeded = AtomicBoolean(false)
}
Step 2: Release the latch in your Initializer
In your app module, update your Jetpack App Startup initializer to count down the latch the moment Firebase is ready:
class FirebaseInitializer : Initializer<Unit> {
    override fun create(context: Context) {
        CoroutineScope(Dispatchers.IO).launch {
            try {
                FirebaseApp.initializeApp(context)
                FirebaseReadiness.initSucceeded.set(true)
            } catch (e: Exception) {
                // Log initialization failure
            } finally {
                // Always release the latch so we don't permanently block the main thread
                FirebaseReadiness.initLatch.countDown()
            }
        }
    }

    override fun dependencies(): List<Class<out Initializer<*>>> = emptyList()
}
Step 3: Block the injection until ready
Back in your core module, update your Hilt @Provides function to wait for the latch.
Crucially: Add a timeout. Never block the main thread indefinitely. If Firebase fails to initialize within 5 seconds, it is better to crash cleanly or provide a fallback than to trigger a guaranteed ANR. Firebase's own Utils.awaitEvenIfOnMainThread()caused 100% reproducible ANRs by doing exactly this — blocking without a reasonable timeout.
@Module
@InstallIn(SingletonComponent::class)
object RemoteConfigModule {
@Provides
@Singleton
fun providesFirebaseRemoteConfig(): FirebaseRemoteConfig {
// Wait up to 5 seconds for the background initializer to finish
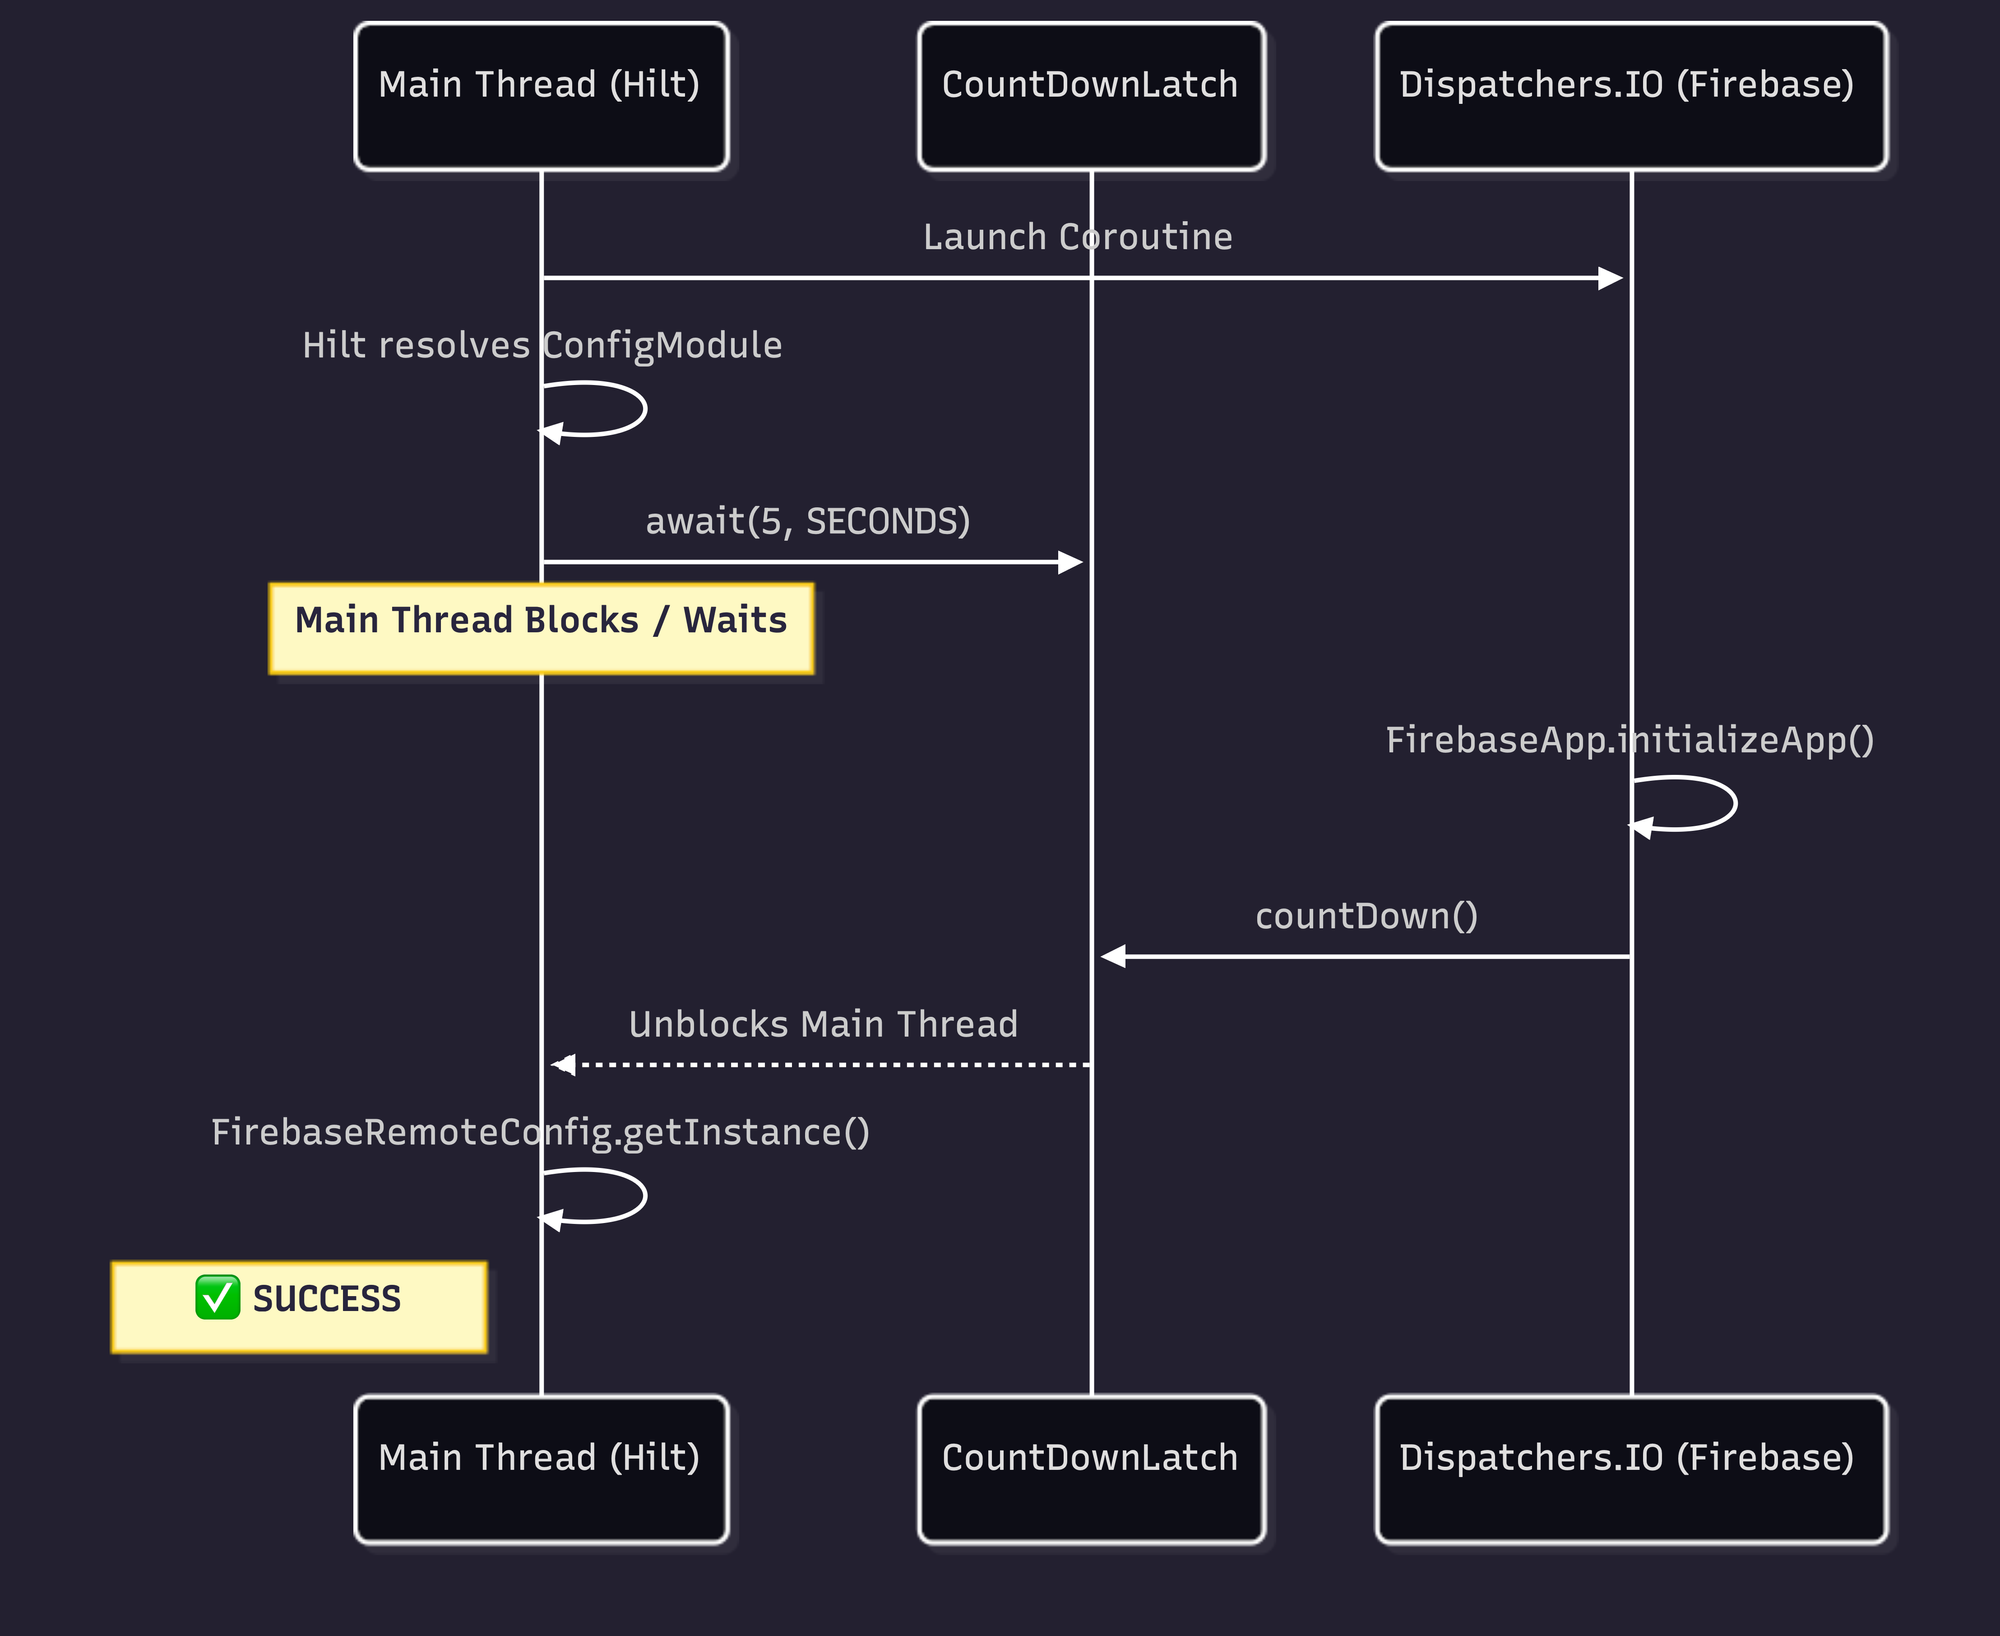
val isReady = FirebaseReadiness.initLatch.await(5, TimeUnit.SECONDS)
check(isReady && FirebaseReadiness.initSucceeded.get()) {
"Firebase initialization timed out or failed in background coroutine."
}
return FirebaseRemoteConfig.getInstance()
}
}A Note on CountDownLatch and Hilt's DoubleCheck
There is a subtle deadlock risk here. Hilt resolves @Singleton-scoped providers through DoubleCheck.get(), which uses synchronized. If your latch producer also needs a scoped dependency from the same Hilt component, you can deadlock: thread A holds the DoubleCheck lock waiting on the latch, thread B needs the DoubleCheck lock to produce the latch value.
Our FirebaseReadiness object avoids this entirely — it is a plain Kotlin object with no DI involvement. The latch is released from a coroutine that has no dependency on any Hilt-provided object.
7. The Connective Tissue: Why This Article Exists
| Domain | Documentation status |
|---|---|
ART compiler-filter=verify behavior |
Well-documented in AOSP, never connected to Play Store |
| Firebase initialization race conditions | Widely reported on GitHub, root cause left vague |
| Pre-launch report "cannot reproduce" crashes | Anecdotally common in forums and issue trackers, no systematic analysis |
The closest anyone has gotten:
- FlutterFire #8837 documents 7.5-second Firebase init in pre-launch but doesn't identify
verifymode as the cause. - Redex #528 documents Firebase/GMS classes like
com.google.firebase.iid.zzactriggering "Class failed lock verification and will run slower" — with a measured 200-300ms startup hit. This is the missing link: classes that fail soft verification in ART fall back to interpreted execution, creating the exact timing expansion we describe. The Android team's own article on mitigating soft verification issues documents up to 22% degradation on a Nexus 5X. - Google Issue Tracker #160907013 has developers asking Google to fix "pre-launch report false positives." No explanation of why they occur.
- android/tuningfork #42 shows a native crash reproducible in Firebase Test Lab but not on dev devices — the same pattern, different layer of the stack.
Nobody wrote the article that connects all five: R8 restructures your code. verify mode slows it down. Firebase init moves to a background coroutine. Hilt resolves synchronously. The race window expands from invisible to catastrophic.
Until now.
The Takeaway
When the Play Store Pre-Launch crawler boots your app in verify mode, the CountDownLatch absorbs the timing variance. If the JIT compiler stalls the main thread, the latch waits. If the emulated CPU is starved for cycles and the coroutine takes 200ms to launch, the latch waits.
The Play Store pre-launch environment runs your app in a fundamentally different way than your development machine. R8 full mode restructures your code, and verify compilation mode changes execution timing. Together, they expose initialization race conditions that are invisible locally.
The fix is not to suppress the crashes, but to eliminate the timing dependencies:
- Use explicit initialization ordering —
CountDownLatchor Jetpack App Startup's dependency graph. - Never block the main thread indefinitely during DI resolution — always use a timeout.
- Test under
verifymode locally before upload —adb shell cmd package compile -m verify -f your.package. - Regenerate Baseline Profiles every release — stale profiles against R8-restructured code are worse than no profile.
- Cover your critical user journeys in the profile generator, not just
startActivityAndWait().
This article is based on a real root cause analysis from a production Android app. The crash appeared during Play Store pre-review, was traced to a three-piece race condition between FirebaseInitProvider removal, background coroutine initialization, and synchronous Hilt DI resolution, and was fixed with the cross-module latch pattern described above.
About the Author
Adit Lal is the CTO and Co-Founder of Travv World, with over 14 years of experience in Android development. When he isn't hunting down Heisenbugs, architecting reactive state machines at scale, or pushing the limits of Kotlin Multiplatform and Jetpack Compose, you can find him sharing mobile performance insights on X/Twitter and GitHub.
References
Official Documentation
- AOSP: Configure ART — Compiler filter definitions
- AOSP: ART Service Configuration — Background dexopt threading
- Play Console: Pre-Launch Report — Google's docs (no compilation mode disclosure)
- Firebase Test Lab — Pre-launch testing infrastructure
- Baseline Profiles Overview — Profile-guided optimization
- Create Baseline Profiles — Generation best practices
- Enable App Optimization with R8 — R8 full mode documentation
- Jetpack App Startup — ContentProvider replacement
GitHub Issues (All Verified)
- firebase-android-sdk #4693 — "FirebaseApp is not initialized" on first Play Store install
- firebase-android-sdk #6145 —
awaitEvenIfOnMainThread()100% reproducible ANR - firebase-android-sdk #4834 — Concurrent SDK init deadlock
- firebase-android-sdk #5936 — 3rd-party SDK race before
FirebaseInitProvidercompletes - firebase-android-sdk #6039 — Separate process init variant
- FlutterFire #8837 — 7.5s Firebase init in pre-launch
- Redex #528 — Firebase classes failing lock verification, 200-300ms startup hit
- Retrofit #3751 — R8 full mode breaks reflection-based method resolution
- kotlinx.coroutines #1304 — R8 vertical class merging breaks coroutine dispatch
- Dagger #1859 —
DoubleCheck.get()ANR contention - android/tuningfork #42 — Native crash in pre-launch, not reproducible on dev devices
- Google Issue Tracker #160907013 — Pre-launch report false positives
Engineering Blog Posts
- Meta: Accelerating Android Apps with Baseline Profiles — Production-scale profile infrastructure
- Firebase Blog: How Does Firebase Initialize on Android? — ContentProvider mechanism (no race condition discussion)
- Android Developers: Mitigating Soft Verification Issues in R8 and D8 — 22% degradation from soft verification
- Groupon: Android's Multidex Slows Down App Startup — ~10x interpreted slowdown documented